Case study · September 26, 2026
47.2 kilometers (29.3 miles). Alone against the clock.
In 2024 I rode the time trial at Lake Attersee on a classic road bike. In 2026 I now want to try it with a time-trial bike; medical checks and months of preparation included. Everything that comes out of it is documented here.
Part 1
The idea: once more, but done right
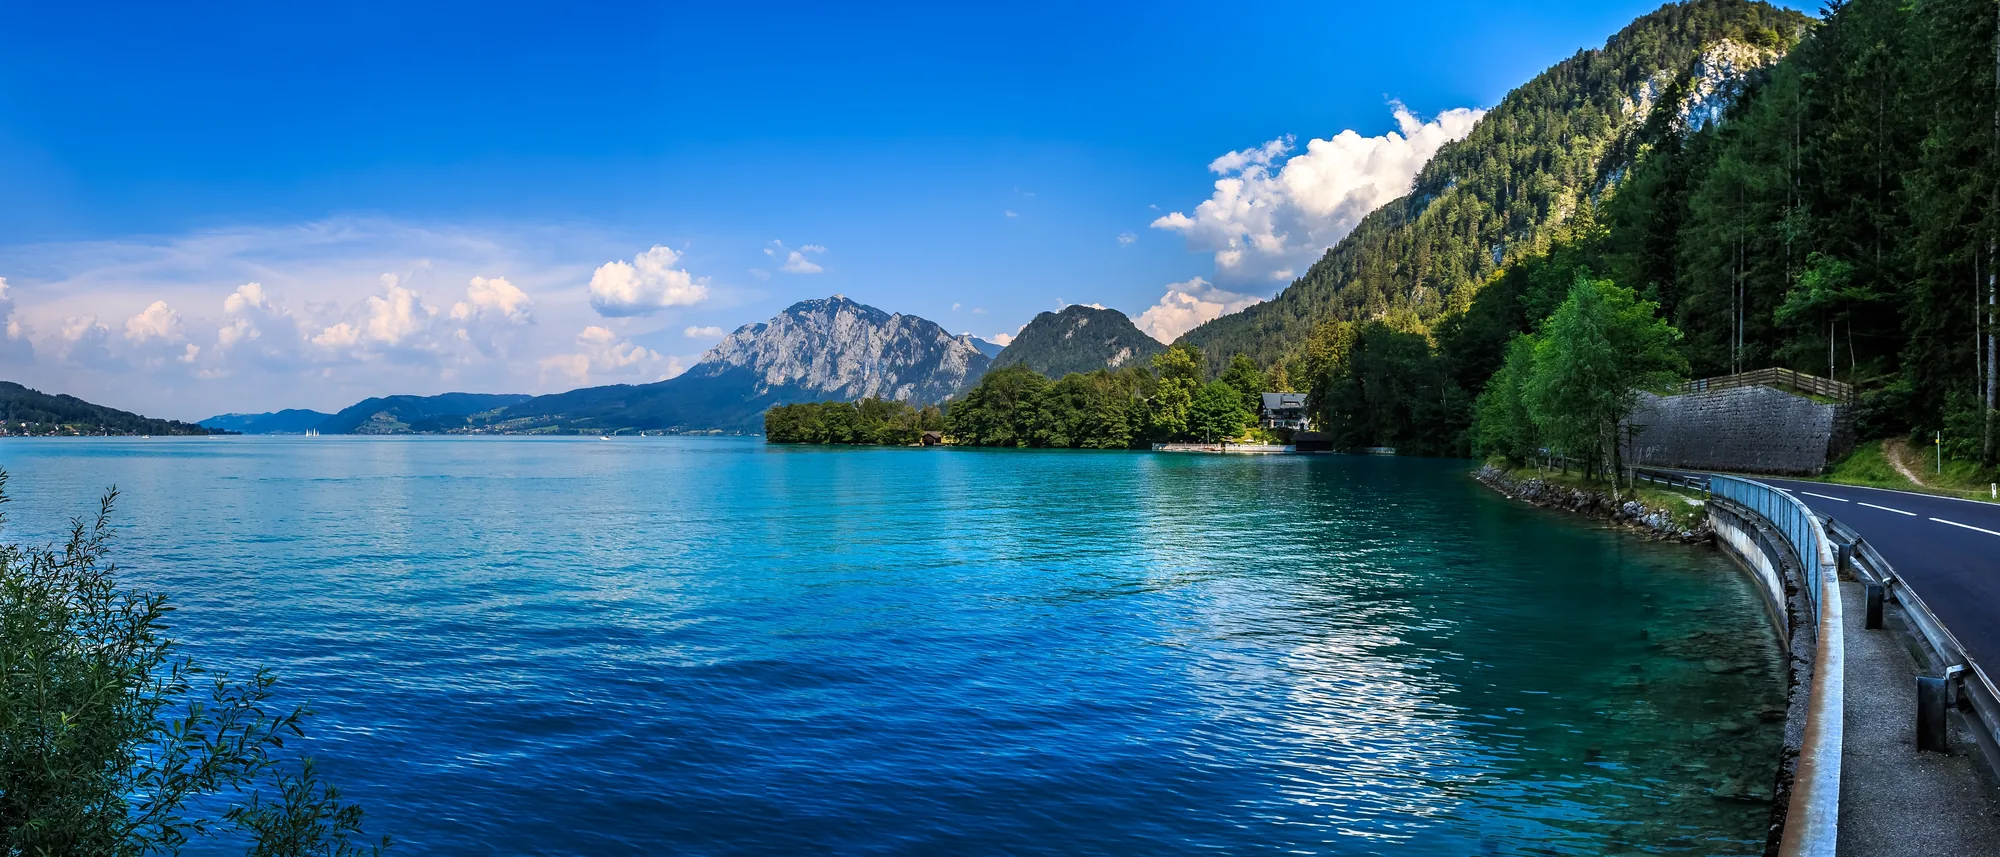
The time trial around Lake Attersee near Salzburg is considered the largest event of its kind in Europe. For a time trial the course is unusually long: pros need about an hour, the slightly less talented amateurs sometimes an hour and a half. An international field of starters – more than 1,500 participants, individual riders as well as teams of four and ten, pros and amateurs mixed. Highly professionally organized, with road closures, marshals and television cameras on motorcycles. The pros don't start at the front, but are spread throughout the field. In 2024 an “Elite Queen of the Lake” was crowned for the first time: this premiere title went to Olympic champion Anna Kiesenhofer with a record time of 1:02:21.64. She started about seven minutes behind me – and powered past me with such force that I was left quite breathless…
Performance diagnostics
Two measurements, two years apart.
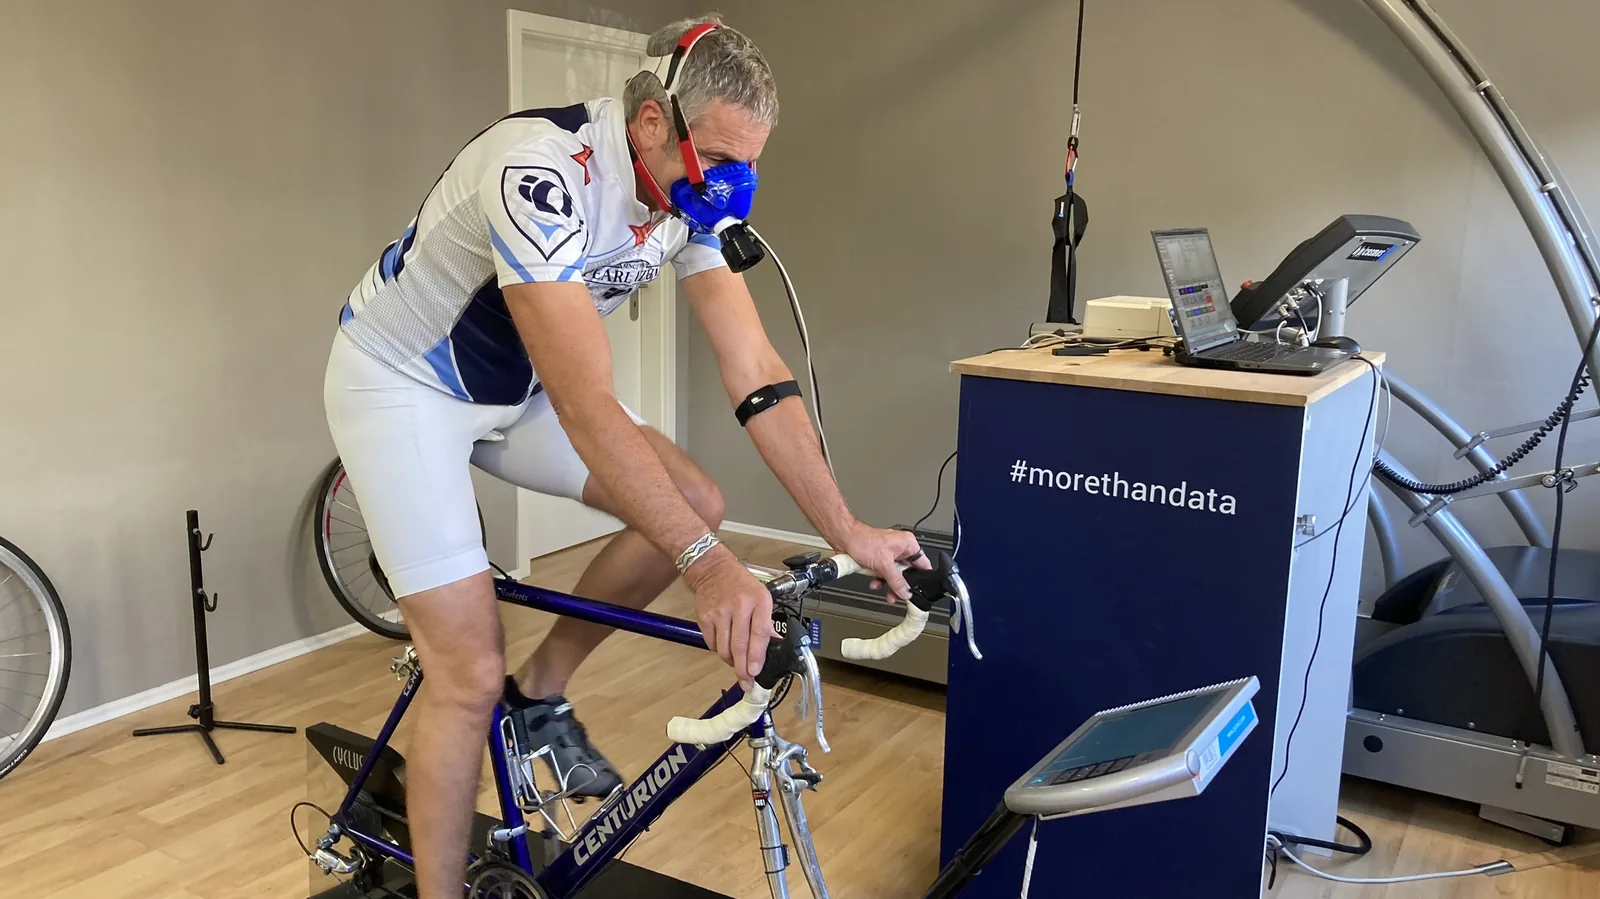
The baseline values come from the lab test in spring 2024. The follow-up measurement took place on August 20, 2026 at the Technical University of Munich — here is the delta.
Baseline values · March 22, 2024
- Lactate formation rate
- 0.59 mmol/s
- Anaerobic threshold
- 232 W 2.8 W/kg
- VO₂max power
- 330 W 43 ml/min/kg
- Body weight
- 84.2 kg at 182 cm
Follow-up measurement · August 20, 2026
- Lactate formation rate
- 0.62 mmol/s
- Anaerobic threshold
- 214 W 2.6 W/kg
- VO₂max power
- 302 W 48.4 ml/min/kg
- Body weight
- 82.2 kg at 182 cm
What the numbers mean
Four values, one goal: finding out how I can prepare my body most efficiently for 47 kilometers against the clock.
The lactate formation rate shows how fast the body produces lactate under load – put simply, how “explosive” the metabolism works. The lower this value is in an endurance athlete, the more energy comes from fat burning instead of quickly depleted sugar reserves. For an 80-minute time trial, a low value is worth its weight in gold – it helps decide how long a hard pace can be sustained at all.
The anaerobic threshold is the power that can just still be sustained over a longer period before lactate forms faster than the body can clear it. It is the most important anchor point for training control: all training zones – from easy to intense – are derived from this value.
The VO₂max power describes the maximum oxygen uptake at full load, i.e. the upper performance limit. It shows the potential – but not whether this pace can also be sustained over the full race distance. That is exactly the real challenge in a time trial.
Body weight feeds into the watts-per-kilo values, which decide mostly on climbs. In a flat time trial like Attersee, by contrast, mainly the absolute watts count – weight plays a smaller role here than in a mountain stage.
What the delta really shows
At first glance the picture seems contradictory: the lactate formation rate has risen slightly instead of dropping, and the anaerobic threshold, at 214 watts, is lower than in 2024. Taken by itself, that would look like a step backward – but it isn't.
The reason: the second measurement took place at a different institute with a slightly different calculation method, and even small differences in the test protocol noticeably shift these two values. What remains comparable is how heart and metabolism react at exactly the same wattage – and there the finding is clear: at 140 watts my heart rate in 2024 was still 119 beats per minute, now it is 100. At 200 watts it was 135, now 120. A markedly lower heart rate at the same power is the direct measure of a more economical, more enduring engine – and it matches the calculated VO₂max, which has risen from 43 to 48.4 ml/min/kg.
At my age one has to settle for smaller gains. What still pleases me a little, though, is the statement of the evaluating physician at TUM that my individual anaerobic threshold (IAT), per kg, corresponds to the 96th percentile (i.e. 96 percent are behind me) among all power, strength and team-sport athletes of my age group.
Part 2
Preparation
To take part, you can apply – by lottery – for the “road bike” class (as I did on my first participation in 2024) or for the time-trial bike class. For this category I managed to snag a starting spot in 2026 with a bit of luck! For months now I have been training my body for the seating position, which is unfamiliar to me, and making technical optimizations to the bike as well as adjustments to clothing and helmet – nothing exaggerated, but everything as it still seems sensible to me as a layman. I had detailed training plans drawn up, which I readjust monthly. There are ups and downs along the training path, and at some point I had to recognize that some of the torture on the bike doesn't translate into real physical improvement at all. That made it clear to me that I should really plan my meals and their composition instead of simply going by feel.
Race tactics
Attersee has two faces. My pace follows them.
East shore flat, west shore hilly – and a steep climb to the church shortly before the finish. Anyone who pedals even watts here ends up riding into a wall. Here is my game plan for the last weeks, the target time and the tactics for the three sections of the course.
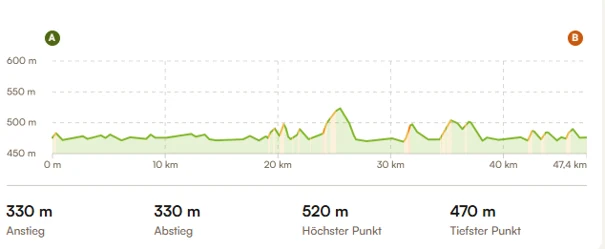
Training focus of the last weeks
After the follow-up measurement it was no longer about getting even fitter, but about bringing my form as close as possible to the real load in the race. Since then, the trainer sessions have featured threshold efforts at exactly the wattage I want to ride in the race – no more, no less. Built in are short bursts that simulate the restless climbs on the west shore, plus repeats of a few minutes, as demanded by the church climb shortly before the finish.
The core of the preparation is a dress rehearsal on the road: if possible the complete distance, ridden at the planned race pace of the three sections – the sharpest test of whether the plan also holds up outside the lab. After that the taper begins: less volume, but keeping the short intense stimuli until shortly before the start.
Goal
In 2024 I rode the course on the road bike in 1:30 hours, averaging about 32 km/h (20 mph). With the time-trial bike, the new position and the watts gained since then, the ambitious goal is now 1:18 to 1:22 hours – an average of about 35 km/h (22 mph), held over the full distance.
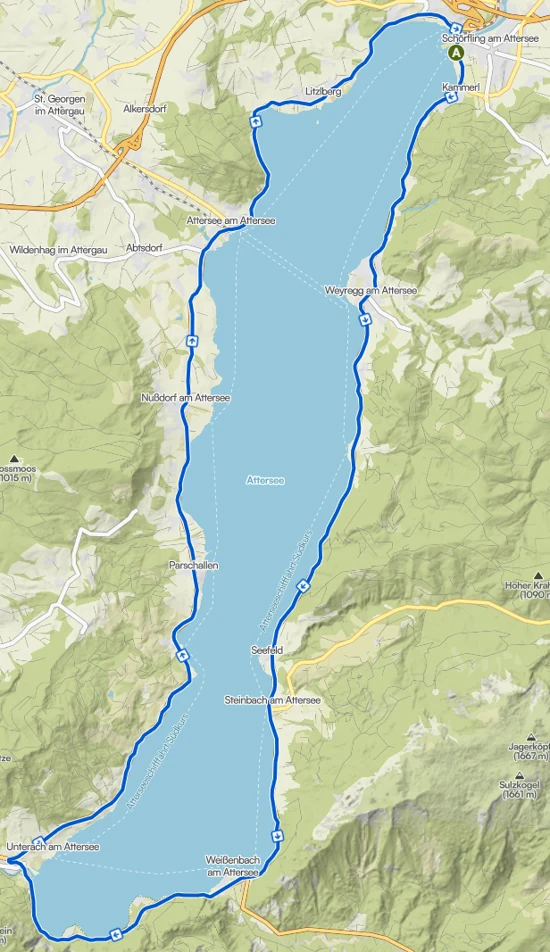
Race tactics in three sections
- East shore · km 0–24
- 205–215 W HR ≤ 130
- West shore · km 24–43
- 210–225 W Peaks up to 245 W · HR up to 136
- Church + finish · km 43–47
- 250–280 W HR up to maximum
The first 24 flat kilometers are the fastest section of the course – which is exactly why they are the greatest temptation to push too many watts. On the west shore the terrain then takes over: several short ramps disrupt the rhythm, and here heart rate counts more than wattage. The real reserve is saved for the steep climb to the church shortly before the finish – there everything that is left may, indeed should, come out.
Part 3
In the race
Start ramp, countdown, and then I was on my way. The first minutes were marked by a nervousness I hadn't expected. My heart rate shot up immediately, and my maximum of the whole day, 162 beats, was already reached at kilometer four. Looking back, I can see in the data that I left the ramp with over 500 watts for the first 30 seconds and kept pedaling up to 250 watts again and again over the first kilometers. That worried me even while riding. I consciously tried to calm down and eased off a little.
I had remembered the east shore up to the southern tip as flatter. It's rolling enough that I couldn't hold the targeted 40 km/h (25 mph) average. After ten kilometers the display still showed a 38, at kilometer 13 it dropped to 37 and shortly after kilometer 20 below 37.
At the start of the way back there was then more climbing than I had in my head. The longest climb shortly before kilometer 25 brings roughly 50 meters of elevation in five minutes. I rode it at about 240 watts, at just 24 to 25 km/h. At the top the average had fallen below 36. The reward came on the downhill stretches: there it briefly went above 60 km/h, with 66 km/h as the peak.
I didn't have a pacing chart by time. I only knew that I must not fall below a 36 average. But that is exactly what happened, and gradually. At kilometer 30, after a descent, it briefly showed 36.4 again. From kilometer 34 on I never got back above 36. That frustrated me, because I saw hardly any way to stop the trend. Over the last ten kilometers the display practically always showed a 35, and I couldn't find a way back.
At the finish the clock stood at 1:21:05. Basically I was satisfied, because that is within my target corridor of 1:18 to 1:22. And yet the pangs of conscience quickly came: shouldn't I have bitten down harder over the last ten kilometers after all? A 1:19 would have made me very happy.
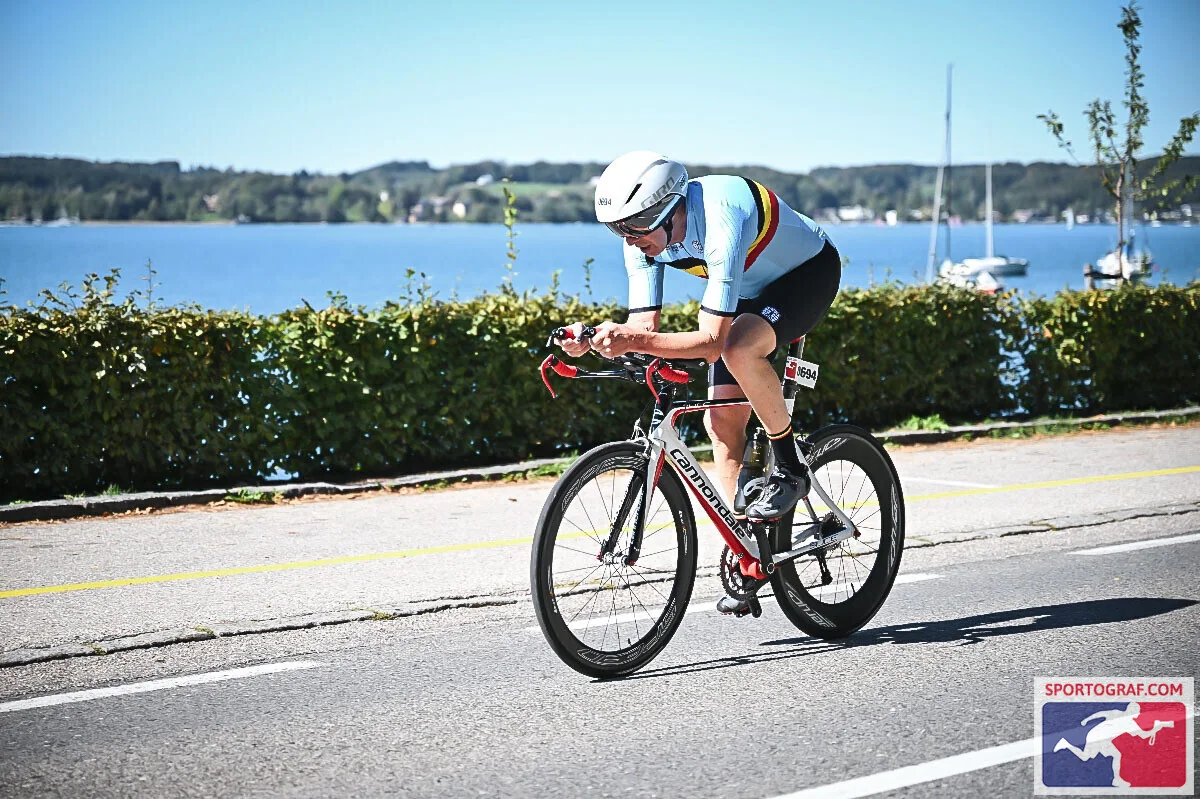
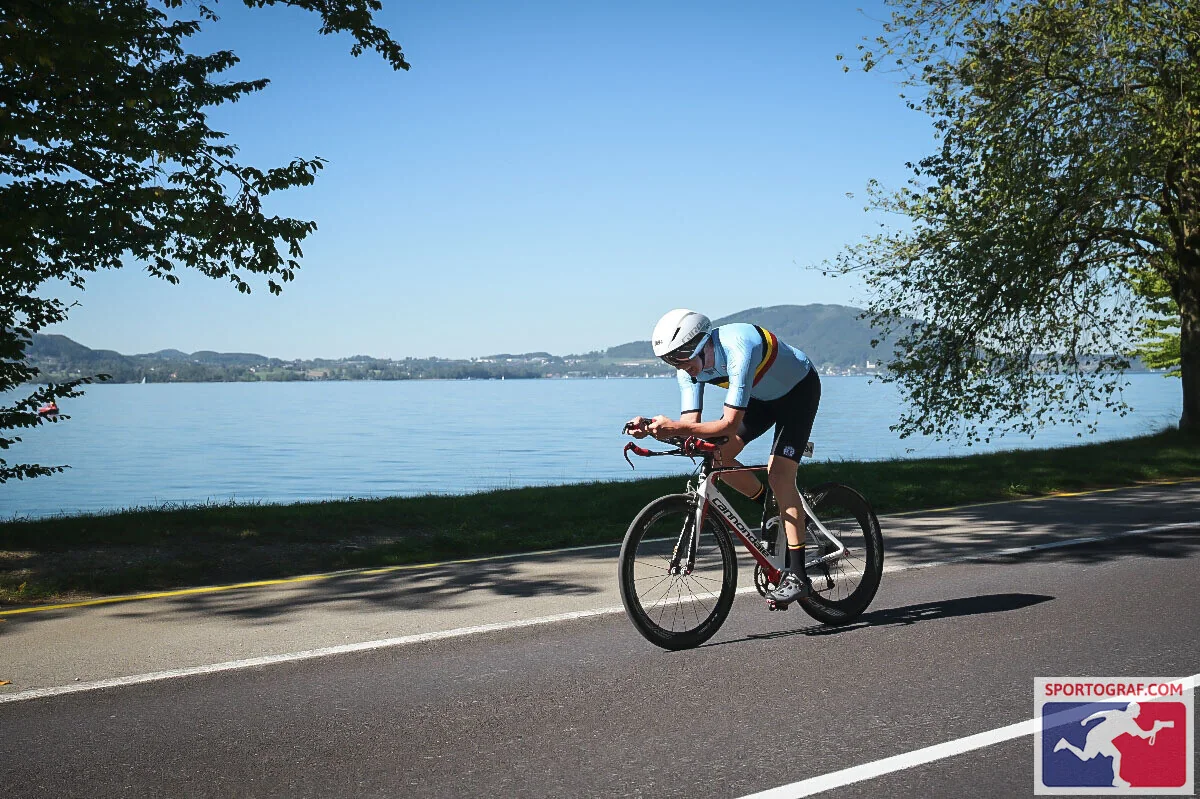
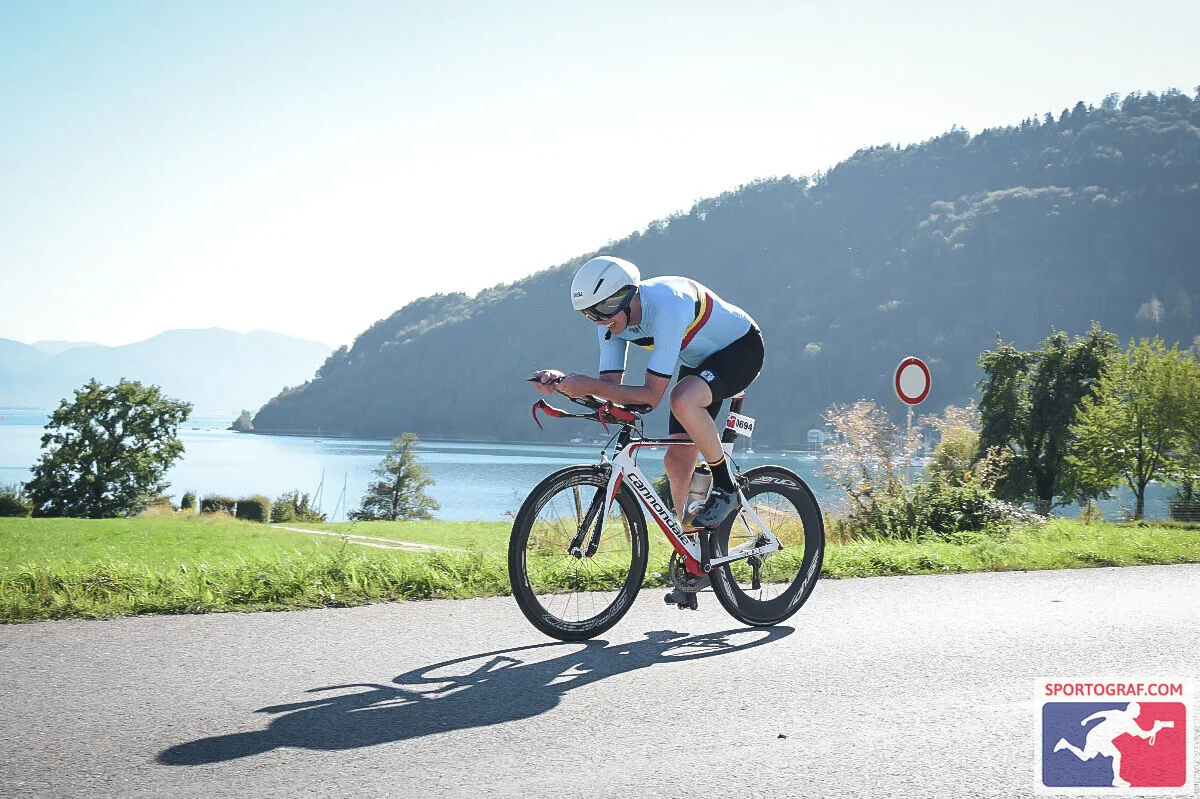
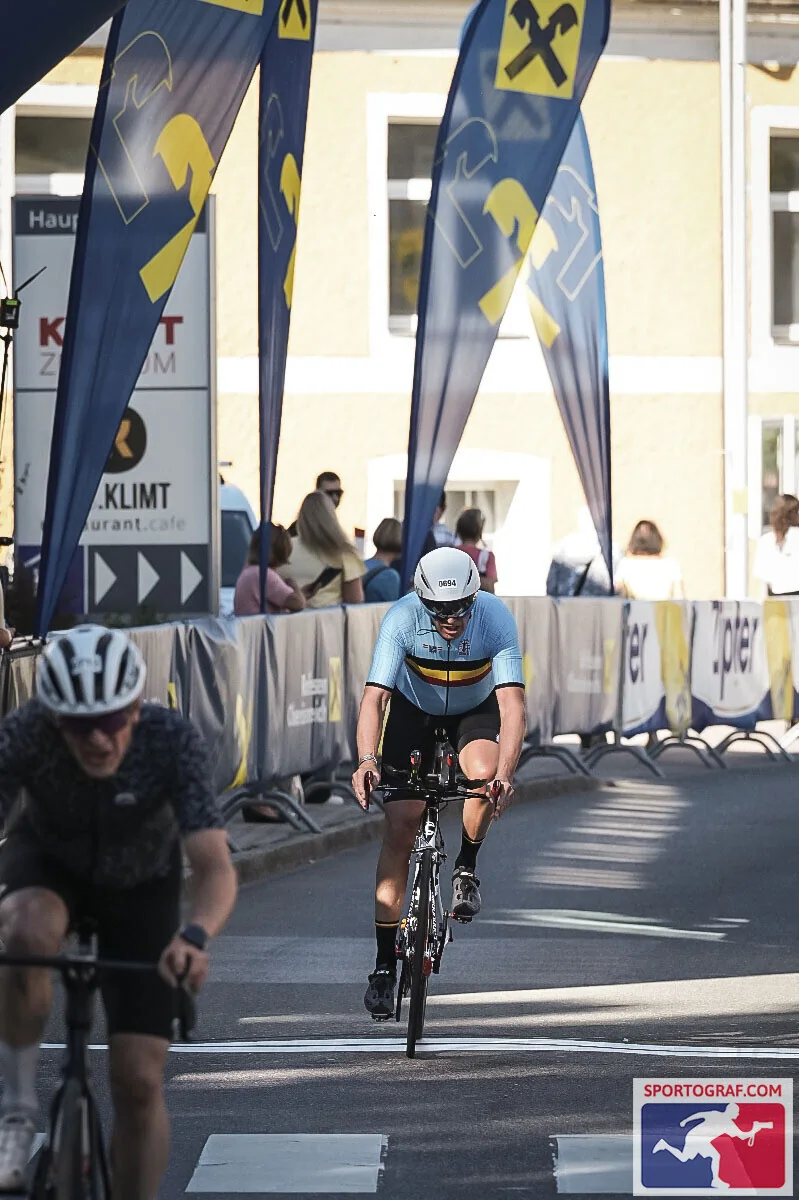
Photo series
Race day, captured from the course.
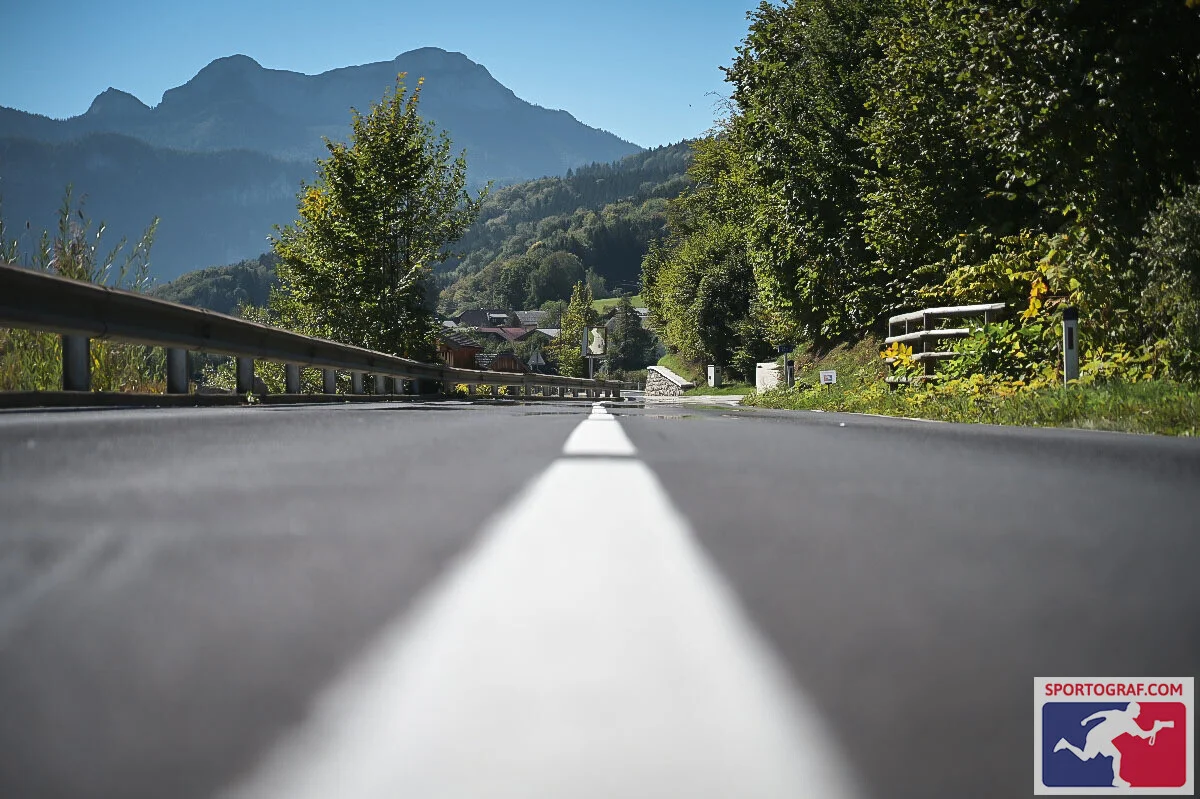
Anyone riding alone against the clock doesn't see much of the lake. All the nicer that the photographers along the course captured the moments I only caught out of the corner of my eye.
Part 4
What remained
Two days later I analyzed the raw race data second by second and compared it with my August performance diagnostics at the Technical University of Munich. The result is more revealing than my feeling at the finish was.
- Finish time
- 1:21:05 Goal 1:18–1:22
- Average speed
- 34.9 km/h over 47.2 km
- Normalized Power
- 219 W IAT per TUM 214 W
- Pedaling power
- 216 W excluding coasting
- Heart rate
- 142 bpm max. 162
- Cadence
- 79 rpm average
What worked
I rode exactly what the diagnostics predicted. My Normalized Power of 219 watts lies almost exactly on my individual anaerobic threshold of 214 watts. For a race of a good 80 minutes, that is the right level.
There was no drop in power. My feeling of fading toward the end is not confirmed by the numbers. Leaving out the coasting phases, I pedaled 216 watts in the first third, likewise 216 watts in the rolling middle section and 221 watts over the last kilometers. Normalized Power stayed nearly constant at 219, 217 and 214 watts, and heart rate was stable at around 142 to 144. The fact that the average dropped anyway was due to the terrain: the climbs of the second half and the descents on which I let it roll. In total that was about five minutes without any pedaling power.
I dosed the climbs correctly. On the long ramp before kilometer 25 I was at about 240 watts, on the shorter rises between 215 and 230 watts. That is clearly above my average, but below Critical Power. A simulation shows: had I stubbornly ridden a constant 203 watts, i.e. my actual overall average including coasting phases, I would have been about one minute slower.
What didn't work
The start. The 30 seconds at over 500 watts off the ramp cost, according to the Critical Power model, about half of my anaerobic reserve (W′). In the end it did no harm, because I calmed down afterwards. But it wasn't necessary either.
The final phase. The plan was to invest everything from the church climb at kilometer 43 with 250 to 280 watts. In reality it was about 220 watts. The model shows that about 12 of 16.7 kilojoules of my anaerobic reserve were still left at the finish. So part of my pangs of conscience is justified.
Average speed as a control variable. The average on the display reacts sluggishly and depends heavily on the terrain. It frustrated me more than it guided me. On top of that came an expectation that didn't fit the physics: for a 40 km/h (25 mph) average on this course I would have needed, with my equipment, clearly more than 250 watts, i.e. more than my threshold.
Would a 1:19 have been possible?
I had it calculated, with a physical model calibrated to my race data:
- Final phase as planned (~260 W from km 43)
- ~1:20:35 about 30 s faster
- plus the last 10 km more consistent (avg. +20 W)
- ~1:20:10 about 55 s faster
- 7 W more pedaling power for the whole race
- ~1:19:59 about 66 s faster
- 10 % less air resistance, same watts
- ~1:18:40 about 2:25 min faster
With more biting at the end alone, it would narrowly not have worked. I would have landed at about 1:20:10. To gain the missing minute on the last ten kilometers alone, I would have had to pedal almost 250 watts on average there, after more than an hour at threshold. That was not realistic. The real lever for the 1:19 would have been seven watts more over the whole race, spread across the climbs.
The equipment
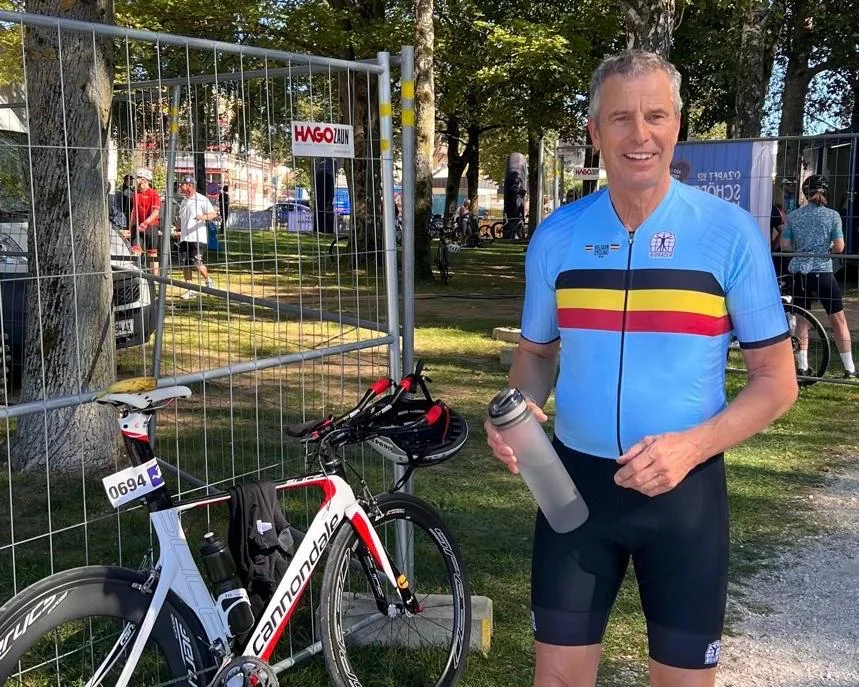
My Cannondale Slice is a pure carbon time-trial bike weighing 8.2 kilos (18 lb), with a handbuilt carbon wheel at the front, a high-profile carbon wheel at the rear, plus Continental GP 5000 S TR tires, a skinsuit from Ryzon and a time-trial helmet from Giro. That is solid equipment, but a generation older than much of what lines up at Attersee: rim brakes, clip-on aerobars instead of an integrated cockpit, no disc wheel at the rear. Only the truly ambitious show up at the start at Attersee, and their equipment is incredible.
Still, the calculation has made me a bit more sober. A 1:15 would have required about a quarter less air resistance at the same power, and equipment alone doesn't deliver that. Realistically I see my potential on this course at 1:17:30 to 1:19 with better equipment and optimal pacing.
What I take away
At the next time trial I will ride by watts and by split times, not by the average on the display. For the first ten minutes I will ignore heart rate, because it then shows excitement, not load. And I won't just plan the final phase, I will ride it too. Most important, though: the months of preparation delivered exactly what they were meant to deliver. I rode 81 minutes at my threshold without collapsing.
Methodology: analysis of the second-by-second data (Sigma ROX 11.1, left-side power meter with doubling). Model calculation with about 92 kg system weight, calibrated to the actual riding time (CdA about 0.26–0.28 m²). Wind is not modeled separately; the values are orders of magnitude, not a guarantee to the second.
To take with you
Sample training and nutrition plans
Achieving above-average performance at an advanced age is not trivial. It requires analysis and strategies on several levels. Here are a few sample plans I prepare by — to look at if you're interested. Please note: the PDFs are in German.